| 2021 | 2022 | 2023 | 2024 (Q1-Q2) | |||||||||
| Sales | $ Volume | % | Sales | $ Volume | % | Sales | $ Volume | % | Sales | $ Volume | % | |
| Burnaby | 7 | $ 81,840,000 | 9% | 6 | $ 73,940,000 | 11% | 6 | $ 59,764,500 | 18% | 7 | $ 100,700,000 | 21% |
| Coquitlam | 5 | $ 81,705,000 | 9% | 8 | $ 44,752,000 | 7% | 7 | $ 18,924,240 | 6% | 1 | $ 12,200,000 | 2% |
| New Westminster | 1 | $ 5,000,000 | 1% | 0 | $ 0 | 0% | 1 | $ 1,000,000 | 0% | 2 | $ 75,240,000 | 15% |
| North Vancouver | 1 | $ 2,450,000 | 0% | 1 | $ 9,100,000 | 1% | 0 | $ 0 | 0% | 1 | $ 145,000,000 | 30% |
| Port Coquitlam | 2 | $ 24,330,000 | 3% | 5 | $ 23,750,000 | 3% | 1 | $ 15,198,798 | 4% | 2 | $ 6,950,000 | 1% |
| Port Moody | 2 | $ 1,880,000 | 0% | 0 | $ 0 | 0% | 0 | $ 0 | 0% | 0 | $ 0 | 0% |
| Richmond | 26 | $ 112,844,610 | 12% | 25 | $ 317,893,139 | 47% | 14 | $ 126,312,800 | 37% | 12 | $ 112,153,851 | 23% |
| Vancouver | 24 | $ 626,157,496 | 67% | 11 | $ 212,160,000 | 31% | 13 | $ 120,194,000 | 35% | 4 | $ 36,425,000 | 7% |
| Total | 56 | $ 936,207,106 | 100% | 56 | $ 681,595,139 | 100% | 42 | $ 341,394,338 | 100% | 29 | $ 488,668,851 | 100% |
| 2021 | ||||
| Burnaby | 7 | $ 81,840,000 | 9% | |
| Coquitlam | 5 | $ 81,705,000 | 9% | |
| New Westminster | 1 | $ 5,000,000 | 1% | |
| North Vancouver | 1 | $ 2,450,000 | 0% | |
| Port Coquitlam | 2 | $ 24,330,000 | 3% | |
| Port Moody | 2 | $ 1,880,000 | 0% | |
| Richmond | 26 | $ 112,844,610 | 12% | |
| Vancouver | 24 | $ 626,157,496 | 67% | |
| Total | 56 | $ 936,207,106 | 100% | |
| 2022 | ||||
| Burnaby | 6 | $ 73,940,000 | 11% | |
| Coquitlam | 8 | $ 44,752,000 | 7% | |
| New Westminster | 0 | $ 0 | 0% | |
| North Vancouver | 1 | $ 9,100,000 | 1% | |
| Port Coquitlam | 5 | $ 23,750,000 | 3% | |
| Port Moody | 0 | $ 0 | 0% | |
| Richmond | 25 | $ 317,893,139 | 47% | |
| Vancouver | 11 | $ 212,160,000 | 31% | |
| Total | 56 | $ 681,595,139 | 100% | |
| 2023 | ||||
| Burnaby | 6 | $ 59,764,500 | 18% | |
| Coquitlam | 7 | $ 18,924,240 | 6% | |
| New Westminster | 1 | $ 1,000,000 | 0% | |
| North Vancouver | 0 | $ 0 | 0% | |
| Port Coquitlam | 1 | $ 15,198,798 | 4% | |
| Port Moody | 0 | $ 0 | 0% | |
| Richmond | 14 | $ 126,312,800 | 37% | |
| Vancouver | 13 | $ 120,194,000 | 35% | |
| Total | 42 | $ 341,394,338 | 100% | |
| 2024 (Q1-Q2) | ||||
| Burnaby | 7 | $ 100,700,000 | 21% | |
| Coquitlam | 1 | $ 12,200,000 | 2% | |
| New Westminster | 2 | $ 75,240,000 | 15% | |
| North Vancouver | 1 | $ 145,000,000 | 30% | |
| Port Coquitlam | 2 | $ 6,950,000 | 1% | |
| Port Moody | 0 | $ 0 | 0% | |
| Richmond | 12 | $ 112,153,851 | 23% | |
| Vancouver | 4 | $ 36,425,000 | 7% | |
| Total | 29 | $ 488,668,851 | 100% | |
| Date | $ Volume | Sales |
| 2019 | ||
| Qtr1 | 87905500 | 11 |
| Qtr2 | 178514700 | 20 |
| Qtr3 | 87102700 | 15 |
| Qtr4 | 89007100 | 10 |
| 2020 | ||
| Qtr1 | 180176444 | 17 |
| Qtr2 | 412219050 | 122 |
| Qtr3 | 159685270.5 | 51 |
| Qtr4 | 203720211.22 | 13 |
| 2021 | ||
| Qtr1 | 180458000 | 16 |
| Qtr2 | 156960000 | 15 |
| Qtr3 | 258736888 | 19 |
| Qtr4 | 340052218.43 | 18 |
| 2022 | ||
| Qtr1 | 309362000 | 16 |
| Qtr2 | 78885000 | 10 |
| Qtr3 | 163063569.18 | 15 |
| Qtr4 | 130284570 | 15 |
| 2023 | ||
| Qtr1 | 156369240 | 18 |
| Qtr2 | 104357598 | 14 |
| Qtr3 | 23647500 | 6 |
| Qtr4 | 58520000 | 5 |
| 2024 | ||
| Qtr1 | 94170000 | 12 |
| Qtr2 | 394498851 | 17 |
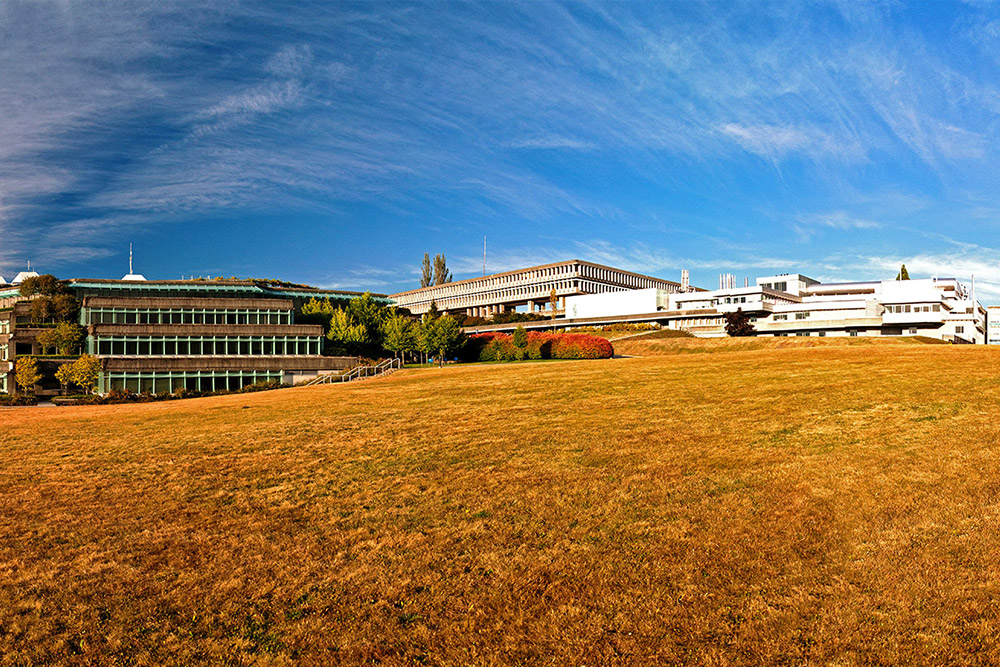
| Transaction Name | Price | Size (Acre) | Price/Acre |
| 5701 Byrne Road | $ 34,500,000 | 6.3 | $ 5,465,779 |
| 3890 Napier Street | $ 2,250,000 | 0.18999999761581 | - |
| 7405 Hedley Avenue | $ 1,950,000 | 0.18199999630451 | - |
| Row Labels | Dollar Volume | Transactions |
| 2019 | 0 | 0 |
| Qtr1 | 22495600 | 3 |
| Qtr2 | 3150000 | 1 |
| Qtr3 | 13350000 | 1 |
| Qtr4 | 1188000 | 1 |
| 2020 | 0 | 0 |
| Qtr1 | 2795000 | 2 |
| Qtr2 | 3880000 | 1 |
| Qtr3 | 8200000 | 1 |
| Qtr4 | 0 | 0 |
| 2021 | 0 | 0 |
| Qtr1 | 0 | 0 |
| Qtr2 | 0 | 0 |
| Qtr3 | 0 | 0 |
| Qtr4 | 0 | 0 |
| 2022 | 0 | 0 |
| Qtr1 | 49200000 | 3 |
| Qtr2 | 0 | 0 |
| Qtr3 | 0 | 0 |
| Qtr4 | 24740000 | 3 |
| 2023 | 0 | 0 |
| Qtr1 | 24310000 | 1 |
| Qtr2 | 6482000 | 2 |
| Qtr3 | 4662500 | 2 |
| Qtr4 | 0 | 0 |
| 2024 | 0 | 0 |
| Qtr1 | 62000000 | 4 |
| Qtr2 | 38700000 | 3 |
| Grand Total | 265153100 | 28 |
| Row Labels | Agricultural | Commercial | Industrial | Institutional | Other | Grand Total |
| 2020 | 0 | 0 | 0 | 0 | 0 | 0 |
| Qtr1 | 2472972.97 | 0 | 0 | 0 | 10994152.05 | 6733562.51 |
| Qtr2 | 0 | 0 | 0 | 25526315.79 | 0 | 25526315.79 |
| Qtr3 | 0 | 0 | 5631868.00 | 0 | 0 | 5631868.00 |
| Qtr4 | 0 | 0 | 0 | 0 | 0 | 0 |
| 2021 | 0 | 0 | 0 | 0 | 0 | 0 |
| Qtr1 | 0 | 0 | 0 | 0 | 0 | 0 |
| Qtr2 | 0 | 0 | 0 | 0 | 0 | 0 |
| Qtr3 | 0 | 0 | 0 | 0 | 0 | 0 |
| Qtr4 | 0 | 0 | 0 | 0 | 0 | 0 |
| 2022 | 0 | 0 | 0 | 0 | 0 | 0 |
| Qtr1 | 0 | 0 | 7986281.67 | 0 | 0 | 7986281.67 |
| Qtr2 | 0 | 0 | 0 | 0 | 0 | 0 |
| Qtr3 | 0 | 0 | 0 | 0 | 0 | 0 |
| Qtr4 | 0 | 0 | 0 | 7344380.00 | 0 | 7344380.00 |
| 2023 | 0 | 0 | 0 | 0 | 0 | 0 |
| Qtr1 | 0 | 0 | 10955025.00 | 0 | 0 | 10955025.00 |
| Qtr2 | 0 | 0 | 0 | 0 | 0 | 0 |
| Qtr3 | 0 | 0 | 0 | 0 | 0 | 0 |
| Qtr4 | 0 | 0 | 0 | 0 | 0 | 0 |
| 2024 | 0 | 0 | 0 | 0 | 0 | 0 |
| Qtr1 | 563698.00 | 0 | 7695652.00 | 0 | 0 | 4129675.00 |
| Qtr 2 | 0 | 0 | 5465779.00 | 0 | 0 | 5465779.00 |
| Grand Total | 1518335.49 | 0 | 7672452.71 | 16435347.89 | 10994152.05 | 8384057.32 |

| Transaction Name | Price | Size (Acre) | Price/Acre |
| 1401 Lucille Starr Drive | $ 12,200,000 | 2.7 | $ 4,468,864 |
| Row Labels | Dollar Volume | Transactions |
| 2019 | 0 | 0 |
| Qtr1 | 0 | 0 |
| Qtr2 | 4898000 | 2 |
| Qtr3 | 4904000 | 1 |
| Qtr4 | 2025000 | 1 |
| 2020 | 0 | 0 |
| Qtr1 | 6605000 | 3 |
| Qtr2 | 91000000 | 2 |
| Qtr3 | 0 | 0 |
| Qtr4 | 0 | 0 |
| 2021 | 0 | 0 |
| Qtr1 | 0 | 0 |
| Qtr2 | 11525000 | 1 |
| Qtr3 | 49180000 | 3 |
| Qtr4 | 21000000 | 1 |
| 2022 | 0 | 0 |
| Qtr1 | 5760000 | 2 |
| Qtr2 | 58650000 | 6 |
| Qtr3 | 6310000 | 2 |
| Qtr4 | 9392000 | 3 |
| 2023 | 0 | 0 |
| Qtr1 | 7386620 | 2 |
| Qtr2 | 1000000 | 1 |
| Qtr3 | 1885000 | 1 |
| Qtr4 | 1266000 | 1 |
| 2024 | 0 | 0 |
| Qtr1 | 0 | 0 |
| Qtr2 | 12200000 | 1 |
| Grand Total | 283159620 | 29 |
| Row Labels | Agricultural | Industrial | Infrastructure | Other | Park | Foreign Investor | Government | Grand Total |
| 2019 | 0 | 0 | 0 | 0 | 0 | 0 | 0 | 0 |
| Qtr1 | 0 | 0 | 0 | 0 | 0 | 0 | 0 | 0.00 |
| Qtr2 | 0 | 0 | 0 | 0 | 0 | 0 | 0 | 0.00 |
| Qtr3 | 0 | 0 | 0 | 0 | 0 | 0 | 0 | 0.00 |
| Qtr4 | 0 | 0 | 0 | 0 | 50625.00 | 0 | 0 | 50625.00 |
| 2020 | 0 | 0 | 0 | 0 | 0 | 0 | 0 | 0 |
| Qtr1 | 492341.00 | 0 | 738540.00 | 0 | 0 | 0 | 0 | 1230881.00 |
| Qtr2 | 0 | 0 | 0 | 0 | 0 | 3082038.00 | 7095159.00 | 10177197.00 |
| Qtr3 | 0 | 0 | 0 | 0 | 0 | 0 | 0 | 0.00 |
| Qtr4 | 0 | 0 | 0 | 0 | 0 | 0 | 0 | 0.00 |
| 2021 | 0 | 0 | 0 | 0 | 0 | 0 | 0 | 0 |
| Qtr1 | 0 | 0 | 0 | 0 | 0 | 0 | 0 | 0.00 |
| Qtr2 | 0 | 0 | 0 | 0 | 0 | 0 | 0 | 0.00 |
| Qtr3 | 650970.00 | 4737475.00 | 0 | 0 | 0 | 0 | 0 | 5388445.00 |
| Qtr4 | 0 | 3107428.00 | 0 | 0 | 0 | 0 | 0 | 3107428.00 |
| 2022 | 0 | 0 | 0 | 0 | 0 | 0 | 0 | 0 |
| Qtr1 | 0 | 0 | 0 | 0 | 0 | 0 | 0 | 0.00 |
| Qtr2 | 299699.50 | 6932471.00 | 0 | 0 | 0 | 0 | 0 | 7232170.50 |
| Qtr3 | 0 | 0 | 0 | 0 | 19006024.00 | 0 | 0 | 19006024.00 |
| Qtr4 | 555556.00 | 0 | 0 | 0 | 0 | 0 | 0 | 555556.00 |
| 2023 | 0 | 0 | 0 | 0 | 0 | 0 | 0 | 0 |
| Qtr1 | 0 | 0 | 0 | 0 | 0 | 0 | 0 | 0.00 |
| Qtr2 | 0 | 0 | 0 | 0 | 0 | 0 | 0 | 0 |
| Qtr3 | 0 | 0 | 0 | 0 | 0 | 0 | 0 | 0 |
| Qtr4 | 0 | 0 | 0 | 0 | 0 | 0 | 0 | 0 |
| 2024 | 0 | 0 | 0 | 0 | 0 | 0 | 0 | 0 |
| Qtr1 | 0 | 0 | 0 | 0 | 0 | 0 | 0 | 0 |
| Qtr2 | 0 | 0 | 0 | 4468864.00 | 0 | 0 | 0 | 4468864 |
| Grand Total | 1998566.50 | 14777374.00 | 738540.00 | 0 | 19056649.00 | 3082038.00 | 7095159.00 | 46748326.50 |
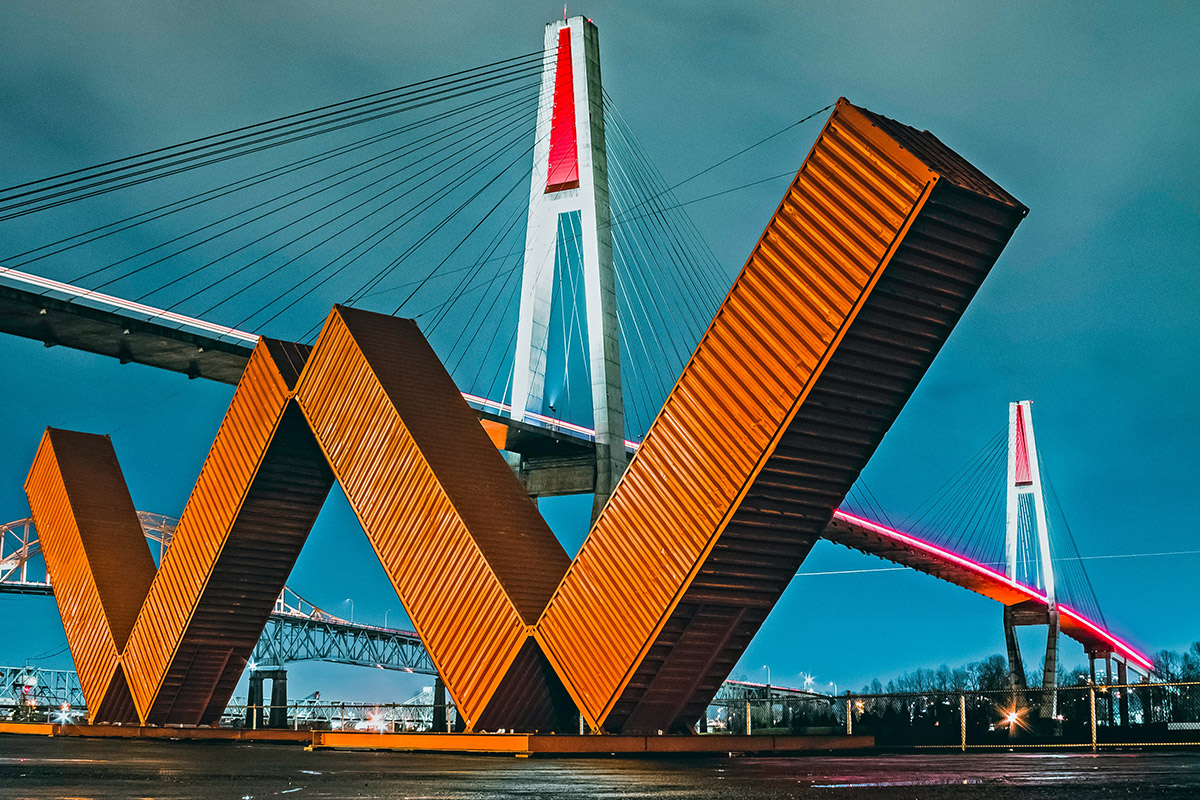
| Transaction Name | Price | Size (Acre) | Price/Acre |
| 1085 Tanaka Court | $ 74,040,000 | 12.9 | $ 5,717,375 |
| Row Labels | Dollar Volume | Transactions |
| 2019 | 0 | 0 |
| Qtr1 | 0 | 0 |
| Qtr2 | 1750000 | 1 |
| Qtr3 | 9515000 | 3 |
| Qtr4 | 1150000 | 1 |
| 2020 | 0 | 0 |
| Qtr1 | 0 | 0 |
| Qtr2 | 0 | 0 |
| Qtr3 | 0 | 0 |
| Qtr4 | 0 | 0 |
| 2021 | 0 | 0 |
| Qtr1 | 0 | 0 |
| Qtr2 | 5000000 | 1 |
| Qtr3 | 0 | 0 |
| Qtr4 | 0 | 0 |
| 2022 | 0 | 0 |
| Qtr1 | 0 | 0 |
| Qtr2 | 0 | 0 |
| Qtr3 | 0 | 0 |
| Qtr4 | 0 | 0 |
| 2023 | 0 | 0 |
| Qtr1 | 0 | 0 |
| Qtr2 | 1000000 | 1 |
| Qtr3 | 0 | 0 |
| Qtr4 | 0 | 0 |
| 2024 | 0 | 0 |
| Qtr1 | 1200000 | 1 |
| Qtr2 | 74040000 | 1 |
| Grand Total | 93655000 | 9 |
| Row Labels | Commercial | Infrastructure | Institutional | Park | Other | Industrial | Grand Total |
| 2019 | 0 | 0 | 0 | 0 | 0 | 0 | 0 |
| Qtr1 | 0 | 0 | 0 | 0 | 0 | 0 | 0.00 |
| Qtr2 | 0 | 0 | 7510729.61 | 0 | 0 | 0 | 7510729.61 |
| Qtr3 | 0 | 25586956.52 | 0 | 0 | 4839357.43 | 0 | 30426313.95 |
| Qtr4 | 0 | 0 | 0 | 5750000.00 | 0 | 0 | 5750000.00 |
| 2020 | 0 | 0 | 0 | 0 | 0 | 0 | 0 |
| Qtr1 | 0 | 0 | 0 | 0 | 0 | 0 | 0.00 |
| Qtr2 | 0 | 0 | 0 | 0 | 0 | 0 | 0.00 |
| Qtr3 | 0 | 0 | 0 | 0 | 0 | 0 | 0.00 |
| Qtr4 | 0 | 0 | 0 | 0 | 0 | 0 | 0.00 |
| 2021 | 0 | 0 | 0 | 0 | 0 | 0 | 0 |
| Qtr1 | 0 | 0 | 0 | 0 | 0 | 0 | 0.00 |
| Qtr2 | 2134927.00 | 0 | 0 | 0 | 0 | 0 | 2134927.00 |
| Qtr3 | 0 | 0 | 0 | 0 | 0 | 0 | 0.00 |
| Qtr4 | 0 | 0 | 0 | 0 | 0 | 0 | 0.00 |
| 2022 | 0 | 0 | 0 | 0 | 0 | 0 | 0 |
| Qtr1 | 0 | 0 | 0 | 0 | 0 | 0 | 0.00 |
| Qtr2 | 0 | 0 | 0 | 0 | 0 | 0 | 0 |
| Qtr3 | 0 | 0 | 0 | 0 | 0 | 0 | 0.00 |
| Qtr4 | 0 | 0 | 0 | 0 | 0 | 0 | 0.00 |
| 2023 | 0 | 0 | 0 | 0 | 0 | 0 | 0 |
| Qtr1 | 0 | 0 | 0 | 0 | 0 | 0 | 0.00 |
| Qtr2 | 0 | 0 | 0 | 0 | 0 | 0 | 0 |
| Qtr3 | 0 | 0 | 0 | 0 | 0 | 0 | 0 |
| Qtr4 | 0 | 0 | 0 | 0 | 0 | 0 | 0 |
| 2024 | 0 | 0 | 0 | 0 | 0 | 0 | 0 |
| Qtr1 | 0 | 0 | 0 | 0 | 0 | 0 | 0 |
| Qtr2 | 0 | 0 | 0 | 0 | 0 | 5717375 | 5717375 |
| Grand Total | 2134927.00 | 12793478.26 | 7510729.61 | 5750000.00 | 4839357.43 | 5717375.00 | 7362763.65 |
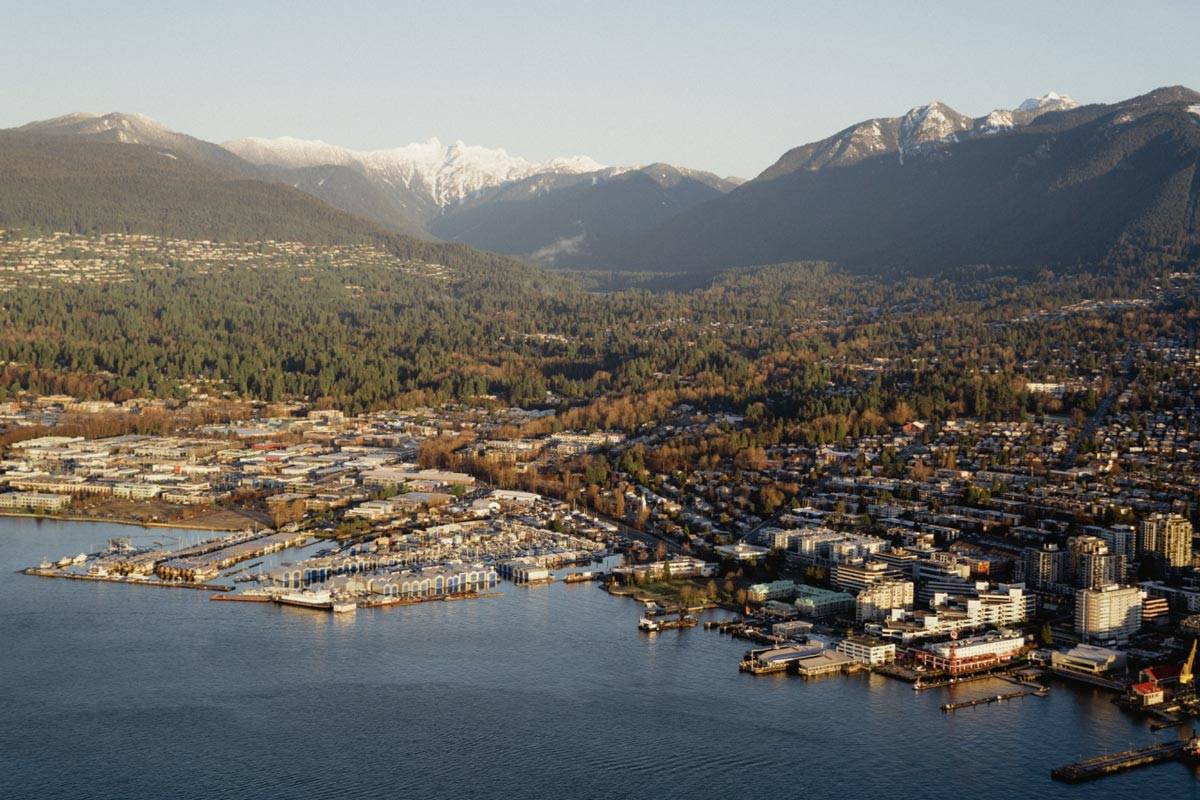
| Transaction Name | Price | Size (Acre) | Price/Acre |
| 100 Forester Street | $ 145,000,000 | 21.4 | $ 6,785,213 |
| Row Labels | Dollar Volume | Transactions |
| 2019 | 0 | 0 |
| Qtr1 | 1150000 | 1 |
| Qtr2 | 12000000 | 1 |
| Qtr3 | 0 | 0 |
| Qtr4 | 0 | 0 |
| 2020 | 0 | 0 |
| Qtr1 | 58550758 | 1 |
| Qtr2 | 0 | 0 |
| Qtr3 | 0 | 0 |
| Qtr4 | 0 | 0 |
| 2021 | 0 | 0 |
| Qtr1 | 0 | 0 |
| Qtr2 | 0 | 0 |
| Qtr3 | 2450000 | 1 |
| Qtr4 | 0 | 0 |
| 2022 | 0 | 0 |
| Qtr1 | 0 | 0 |
| Qtr2 | 0 | 0 |
| Qtr3 | 9100000 | 1 |
| Qtr4 | 0 | 0 |
| 2023 | 0 | 0 |
| Qtr1 | 0 | 0 |
| Qtr2 | 0 | 0 |
| Qtr3 | 0 | 0 |
| Qtr4 | 0 | 0 |
| 2024 | 0 | 0 |
| Qtr1 | 0 | 0 |
| Qtr2 | 145000000 | 1 |
| Grand Total | 228250758 | 6 |
| Row Labels | Industrial | Institutional | Recreation | Grand Total |
| 2019 | 0 | 0 | 0 | 0 |
| Qtr1 | 0 | 6353591.16 | 0 | 6353591.16 |
| Qtr2 | 11718750.00 | 0 | 0 | 11718750.00 |
| Qtr3 | 0 | 0 | 0 | 0.00 |
| Qtr4 | 0 | 0 | 0 | 0.00 |
| 2020 | 0 | 0 | 0 | 0 |
| Qtr1 | 0 | 0 | 48555.59 | 48555.59 |
| Qtr2 | 0 | 0 | 0 | 0.00 |
| Qtr3 | 0 | 0 | 0 | 0.00 |
| Qtr4 | 0 | 0 | 0 | 0.00 |
| 2021 | 0 | 0 | 0 | 0 |
| Qtr1 | 0 | 0 | 0 | 0.00 |
| Qtr2 | 0 | 0 | 0 | 0.00 |
| Qtr3 | 0 | 0 | 0 | 0.00 |
| Qtr4 | 0 | 0 | 0 | 0.00 |
| 2022 | 0 | 0 | 0 | 0 |
| Qtr1 | 0 | 0 | 0 | 0.00 |
| Qtr2 | 0 | 0 | 0 | 0.00 |
| Qtr3 | 0 | 0 | 0 | 0.00 |
| Qtr4 | 0 | 0 | 0 | 0.00 |
| 2023 | 0 | 0 | 0 | 0 |
| Qtr1 | 0 | 0 | 0 | 0.00 |
| Qtr2 | 0 | 0 | 0 | 0 |
| Qtr3 | 0 | 0 | 0 | 0 |
| Qtr4 | 0 | 0 | 0 | 0 |
| 2024 | 0 | 0 | 0 | 0 |
| Qtr1 | 0 | 0 | 0 | 0 |
| Qtr2 | 6785213 | 0 | 0 | 6785213 |
| Grand Total | 9251981.50 | 6353591.16 | 48555.59 | 4981221.95 |

| Transaction Name | Price | Size (Acre) | Price/Acre |
| Row Labels | Dollar Volume | Transactions |
| 2019 | 0 | 0 |
| Qtr1 | 0 | 0 |
| Qtr2 | 62050000 | 3 |
| Qtr3 | 22000000 | 1 |
| Qtr4 | 3790000 | 1 |
| 2020 | 0 | 0 |
| Qtr1 | 10400000 | 1 |
| Qtr2 | 2700000 | 1 |
| Qtr3 | 0 | 0 |
| Qtr4 | 14065600 | 2 |
| 2021 | 0 | 0 |
| Qtr1 | 0 | 0 |
| Qtr2 | 1830000 | 1 |
| Qtr3 | 22500000 | 1 |
| Qtr4 | 0 | 0 |
| 2022 | 0 | 0 |
| Qtr1 | 14050000 | 2 |
| Qtr2 | 0 | 0 |
| Qtr3 | 9700000 | 3 |
| Qtr4 | 0 | 0 |
| 2023 | 0 | 0 |
| Qtr1 | 0 | 0 |
| Qtr2 | 15198798 | 1 |
| Qtr3 | 0 | 0 |
| Qtr4 | 0 | 0 |
| 2024 | 0 | 0 |
| Qtr1 | 6950000 | 2 |
| Qtr2 | 0 | 0 |
| Grand Total | 185234398 | 19 |
| Row Labels | Agricultural | Commercial | Industrial | Institutional | Grand Total |
| 2019 | 0 | 0 | 0 | 0 | 0 |
| Qtr1 | 0 | 0 | 0 | 0 | 0.00 |
| Qtr2 | 697115.00 | 0 | 2129119.50 | 0 | 2826234.50 |
| Qtr3 | 0 | 0 | 2272727.00 | 0 | 2272727.00 |
| Qtr4 | 783058.00 | 0 | 0 | 0 | 783058.00 |
| 2020 | 0 | 0 | 0 | 0 | 0 |
| Qtr1 | 0 | 0 | 3172666.00 | 0 | 3172666.00 |
| Qtr2 | 0 | 0 | 0 | 9310344.83 | 9310344.83 |
| Qtr3 | 0 | 0 | 0 | 0 | 0.00 |
| Qtr4 | 0 | 0 | 1379133.00 | 0 | 1379133.00 |
| 2021 | 0 | 0 | 0 | 0 | 0 |
| Qtr1 | 0 | 0 | 0 | 0 | 0.00 |
| Qtr2 | 349437.00 | 0 | 0 | 0 | 349437.00 |
| Qtr3 | 0 | 2592763.00 | 0 | 0 | 2592763.00 |
| Qtr4 | 0 | 0 | 0 | 0 | 0.00 |
| 2022 | 0 | 0 | 0 | 0 | 0 |
| Qtr1 | 1163985.00 | 0 | 2130000.00 | 0 | 3293985.00 |
| Qtr2 | 0 | 0 | 0 | 0 | 0.00 |
| Qtr3 | 464053.50 | 0 | 0 | 0 | 464053.50 |
| Qtr4 | 0 | 0 | 0 | 0 | 0.00 |
| 2023 | 0 | 0 | 0 | 0 | 0 |
| Qtr1 | 0 | 0 | 10955025.00 | 0 | 10955025.00 |
| Qtr2 | 0 | 0 | 0 | 0 | 0 |
| Qtr3 | 0 | 0 | 0 | 0 | 0 |
| Qtr4 | 0 | 0 | 0 | 0 | 0 |
| 2024 | 0 | 0 | 0 | 0 | 0 |
| Qtr1 | 460000 | 0 | 3206897 | 0 | 1833448.5 |
| Qtr2 | 0 | 0 | 0 | 0 | 0 |
| Grand Total | 625957.43 | 2592763.00 | 2345666.00 | 9310344.83 | 2044029.49 |
| Transaction Name | Price | Size (Acre) | Price/Acre |
| No Transactions in 2023 - Q4 | - | - | - |
| Row Labels | Dollar Volume | Transactions |
| 2019 | 0 | 0 |
| Qtr1 | 0 | 0 |
| Qtr2 | 10400000 | 2 |
| Qtr3 | 5774700 | 2 |
| Qtr4 | 0 | 0 |
| 2020 | 0 | 0 |
| Qtr1 | 2750000 | 1 |
| Qtr2 | 0 | 0 |
| Qtr3 | 0 | 0 |
| Qtr4 | 0 | 0 |
| 2021 | 0 | 0 |
| Qtr1 | 1880000 | 2 |
| Qtr2 | 0 | 0 |
| Qtr3 | 0 | 0 |
| Qtr4 | 0 | 0 |
| 2022 | 0 | 0 |
| Qtr1 | 0 | 0 |
| Qtr2 | 0 | 0 |
| Qtr3 | 0 | 0 |
| Qtr4 | 0 | 0 |
| 2023 | 0 | 0 |
| Qtr1 | 0 | 0 |
| Qtr2 | 0 | 0 |
| Qtr3 | 0 | 0 |
| Qtr4 | 0 | 0 |
| 2024 | 0 | 0 |
| Qtr1 | 0 | 0 |
| Qtr2 | 0 | 0 |
| Grand Total | 20804700 | 7 |
| Row Labels | Commercial | Industrial | Park | Grand Total |
| 2019 | 0 | 0 | 0 | 0 |
| Qtr1 | 0 | 0 | 0 | 0.00 |
| Qtr2 | 0 | 9848484.85 | 3900000.00 | 13748484.85 |
| Qtr3 | 4616304.35 | 14228723.40 | 0 | 18845027.75 |
| Qtr4 | 0 | 0 | 0 | 0.00 |
| 2020 | 0 | 0 | 0 | 0 |
| Qtr1 | 4486133.77 | 0 | 0 | 4486133.77 |
| Qtr2 | 0 | 0 | 0 | 0.00 |
| Qtr3 | 0 | 0 | 0 | 0.00 |
| Qtr4 | 0 | 0 | 0 | 0.00 |
| 2021 | 0 | 0 | 0 | 0 |
| Qtr1 | 0 | 0 | 0 | 0.00 |
| Qtr2 | 0 | 0 | 0 | 0.00 |
| Qtr3 | 0 | 0 | 0 | 0.00 |
| Qtr4 | 0 | 0 | 0 | 0.00 |
| 2022 | 0 | 0 | 0 | 0 |
| Qtr1 | 0 | 0 | 0 | 0.00 |
| Qtr2 | 0 | 0 | 0 | 0.00 |
| Qtr3 | 0 | 0 | 0 | 0.00 |
| Qtr4 | 0 | 0 | 0 | 0.00 |
| 2023 | 0 | 0 | 0 | 0 |
| Qtr1 | 0 | 0 | 0 | 0.00 |
| Qtr2 | 0 | 0 | 0 | 0 |
| Qtr3 | 0 | 0 | 0 | 0 |
| Qtr4 | 0 | 0 | 0 | 0 |
| 2024 | 0 | 0 | 0 | 0 |
| Qtr1 | 0 | 0 | 0 | 0 |
| Qtr2 | 0 | 0 | 0 | 0 |
| Grand Total | 9102438.12 | 24077208.25 | 3900000.00 | 37079646.37 |
| Transaction Name | Price | Size (Acre) | Price/Acre |
| 22451 Gilley Road | $ 3,360,000 | 8.0 | $ 420,000 |
| Row Labels | Dollar Volume | Transactions |
| 2019 | 0 | 0 |
| Qtr1 | 14809900 | 4 |
| Qtr2 | 45092800 | 6 |
| Qtr3 | 12609000 | 5 |
| Qtr4 | 48166100 | 4 |
| 2020 | 0 | 0 |
| Qtr1 | 12651000 | 5 |
| Qtr2 | 8835000 | 2 |
| Qtr3 | 16749888 | 5 |
| Qtr4 | 26040000 | 4 |
| 2021 | 0 | 0 |
| Qtr1 | 27578000 | 6 |
| Qtr2 | 33030000 | 7 |
| Qtr3 | 18568888 | 6 |
| Qtr4 | 33667722 | 7 |
| 2022 | 0 | 0 |
| Qtr1 | 106882000 | 5 |
| Qtr2 | 49560000 | 7 |
| Qtr3 | 69548569.18 | 6 |
| Qtr4 | 91902570 | 7 |
| 2023 | 0 | 0 |
| Qtr1 | 69476000 | 8 |
| Qtr2 | 53476800 | 5 |
| Qtr3 | 0 | 0 |
| Qtr4 | 3360000 | 1 |
| 2024 | 0 | 0 |
| Qtr1 | 10595000 | 3 |
| Qtr2 | 101558851 | 9 |
| Grand Total | 854158088.18 | 112 |
| Row Labels | Agricultural | Agricultural Business | Commercial | Industrial | Grand Total |
| 2019 | 0 | 0 | 0 | 0 | 0 |
| Qtr1 | 6192545.87 | 472049.69 | 12049689.44 | 4872563.72 | 23586848.72 |
| Qtr2 | 2864687.57 | 0 | 7734193.51 | 1940035.27 | 12538916.35 |
| Qtr3 | 1238647.41 | 0 | 16347419.83 | 0 | 17586067.25 |
| Qtr4 | 2005773.51 | 0 | 0 | 2859862.19 | 4865635.71 |
| 2020 | 0 | 0 | 0 | 0 | 0 |
| Qtr1 | 328016.18 | 203802.37 | 3923076.92 | 4476661.33 | 8931556.80 |
| Qtr2 | 555000.00 | 0 | 0 | 3663845.00 | 4218845.00 |
| Qtr3 | 732695.00 | 743767.00 | 0 | 0 | 1476462.00 |
| Qtr4 | 1127931.00 | 654000.00 | 0 | 4356846.00 | 6138777.00 |
| 2021 | 0 | 0 | 0 | 0 | 0 |
| Qtr1 | 0 | 0 | 0 | 0 | 0.00 |
| Qtr2 | 0 | 0 | 0 | 0 | 0.00 |
| Qtr3 | 1106815.00 | 0 | 0 | 0 | 1106815.00 |
| Qtr4 | 832683.33 | 389243.50 | 0 | 5388889.00 | 6610815.83 |
| 2022 | 0 | 0 | 0 | 0 | 0 |
| Qtr1 | 695200.00 | 0 | 0 | 5611136.00 | 6306336.00 |
| Qtr2 | 1174447.00 | 1977728.00 | 0 | 0 | 3152175.00 |
| Qtr3 | 459182.75 | 0 | 0 | 5551443.00 | 6010625.75 |
| Qtr4 | 490269.00 | 509771.00 | 0 | 9623431.00 | 10623471.00 |
| 2023 | 0 | 0 | 0 | 0 | 0 |
| Qtr1 | 1576763.00 | 0 | 0 | 8782051.00 | 5179407 |
| Qtr2 | 517762.00 | 0 | 0 | 4242201.00 | 2379981.5 |
| Qtr3 | 0 | 0 | 0 | 0 | 0 |
| Qtr4 | 420000.00 | 0 | 0 | 0 | 420000 |
| 2024 | 0 | 0 | 0 | 0 | 0 |
| Qtr1 | 745106 | 0 | 0 | 0 | 745106 |
| Qtr2 | 1104692.25 | 0 | 0 | 0 | 1104692.25 |
| Grand Total | 0 | 0 | 0 | 0 | 0 |
| Transaction Name | Price | Size (Acre) | Price/Acre |
| 8480 Granville Street | $ 12,500,000 | 0.2 | - |
| 57 Lakewood Drive | $ 10,500,000 | - | - |
| Row Labels | Dollar Volume | Transactions |
| 2019 | 0 | 0 |
| Qtr1 | 49450000 | 3 |
| Qtr2 | 39173900 | 4 |
| Qtr3 | 18950000 | 2 |
| Qtr4 | 14000000 | 1 |
| 2020 | 0 | 0 |
| Qtr1 | 86424686 | 4 |
| Qtr2 | 21700000 | 3 |
| Qtr3 | 57435000 | 4 |
| Qtr4 | 158984611.22 | 5 |
| 2021 | 0 | 0 |
| Qtr1 | 151000000 | 8 |
| Qtr2 | 81975000 | 5 |
| Qtr3 | 164088000 | 7 |
| Qtr4 | 230344496.43 | 5 |
| 2022 | 0 | 0 |
| Qtr1 | 136350000 | 5 |
| Qtr2 | 0 | 0 |
| Qtr3 | 71560000 | 4 |
| Qtr4 | 4250000 | 2 |
| 2023 | 0 | 0 |
| Qtr1 | 23500000 | 4 |
| Qtr2 | 27200000 | 4 |
| Qtr3 | 15600000 | 2 |
| Qtr4 | 53894000 | 3 |
| 2024 | 0 | 0 |
| Qtr1 | 13425000 | 2 |
| Qtr2 | 23000000 | 2 |
| Grand Total | 1442304693.65 | 79 |
| Row Labels | Agricultural | Commercial | Industrial | Infrastructure | Office | Park | Government | Long Term | Grand Total | |||
| 2019 | 0 | 0 | 0 | 0 | 0 | 0 | 0 | 0 | 0 | 0 | 0 | 0 |
| Qtr1 | 0 | 37998174.56 | 0 | 0 | 0 | 0 | 0 | 0 | 37998174.56 | 0 | 0 | 0 |
| Qtr2 | 0 | 36015923.59 | 21075135.14 | 0 | 0 | 17119565.22 | 0 | 0 | 74210623.95 | 0 | 0 | 0 |
| Qtr3 | 0 | 0 | 16943521.59 | 0 | 0 | 37432432.43 | 0 | 0 | 54375954.03 | 0 | 0 | 0 |
| Qtr4 | 0 | 0 | 100719424.46 | 0 | 0 | 0 | 0 | 0 | 100719424.46 | 0 | 0 | 0 |
| 2020 | 0 | 0 | 0 | 0 | 0 | 0 | 0 | 0 | 0 | 0 | 0 | 0 |
| Qtr1 | 0 | 91665104.48 | 0 | 76923076.92 | 45883221.26 | 0 | 0 | 0 | 214471402.66 | 0 | 0 | 0 |
| Qtr2 | 0 | 0 | 0 | 0 | 3191057.00 | 0 | 3191057.00 | 0 | 6382114.00 | 0 | 0 | 0 |
| Qtr3 | 0 | 0 | 0 | 0 | 0 | 0 | 0 | 0 | 0.00 | 0 | 0 | 0 |
| Qtr4 | 0 | 0 | 9138291.67 | 0 | 0 | 0 | 0 | 0 | 9138291.67 | 0 | 0 | 0 |
| 2021 | 0 | 0 | 0 | 0 | 0 | 0 | 0 | 0 | 0 | 0 | 0 | 0 |
| Qtr1 | 0 | 35941476.00 | 0 | 0 | 0 | 0 | 0 | 0 | 35941476.00 | 0 | 0 | 0 |
| Qtr2 | 0 | 0 | 0 | 0 | 0 | 0 | 0 | 0 | 0.00 | 0 | 0 | 0 |
| Qtr3 | 7737931.00 | 0 | 0 | 0 | 55876102.00 | 0 | 0 | 0 | 63614033.00 | 0 | 0 | 0 |
| Qtr4 | 0 | 0 | 12178485.50 | 0 | 0 | 0 | 0 | 0 | 12178485.50 | 0 | 0 | 0 |
| 2022 | 0 | 0 | 0 | 0 | 0 | 0 | 0 | 0 | 0 | 0 | 0 | 0 |
| Qtr1 | 3756574.00 | 0 | 0 | 0 | 0 | 0 | 0 | 69589422.00 | 73345996.00 | 0 | 0 | 0 |
| Qtr2 | 0 | 0 | 0 | 0 | 0 | 0 | 0 | 0 | 0.00 | 0 | 0 | 0 |
| Qtr3 | 0 | 0 | 12092732.00 | 12273254.00 | 0 | 0 | 0 | 0 | 24365986.00 | 0 | 0 | 0 |
| Qtr4 | 0 | 0 | 0 | 0 | 0 | 0 | 0 | 0 | 0.00 | 0 | 0 | 0 |
| 2023 | 0 | 0 | 0 | 0 | 0 | 0 | 0 | 0 | 0 | 0 | 0 | 0 |
| Qtr1 | 0 | 0 | 0 | 0 | 0 | 0 | 0 | 0 | 0.00 | 0 | 0 | 0 |
| Qtr2 | 0 | 0 | 9696970.00 | 0 | 0 | 0 | 0 | 0 | 9696970.00 | 0 | 0 | 0 |
| Qtr3 | 0 | 0 | 0 | 0 | 0 | 0 | 0 | 0 | 0 | 0 | 0 | 0 |
| Qtr4 | 0 | 25777778.00 | 0 | 0 | 0 | 0 | 0 | 0 | 25777778.00 | 0 | 0 | 0 |
| 2024 | 0 | 0 | 0 | 0 | 0 | 0 | 0 | 0 | 0 | 0 | 0 | 0 |
| Qtr1 | 0 | 0 | 0 | 0 | 0 | 0 | 0 | 0 | 0 | 0 | 0 | 0 |
| Qtr2 | 0 | 0 | 0 | 0 | 0 | 0 | 0 | 0 | 0 | 0 | 0 | 0 |
| Grand Total | 11494505.00 | 227398456.63 | 181844560.36 | 89196330.92 | 104950380.26 | 0 | 0 | 0 | 706741961.82 | 0 | 0 | 0 |